Blog
Over the past few decades, polycarboxylate superplasticizer (PCE) has attracted much attention for its ability to reduce water consumption in concrete or improve workability when added. PCE molecules have a comb-like structure: a main chain carrying anionic groups (including carboxyl, sulfonic, and phosphate groups) and grafted long side chains (such as polyethylene glycol terminated with hydroxyl or methyl groups). The anionic groups act as adsorption sites via electrostatic interactions with cement particles, while the side chains provide steric hindrance to prevent cement particle flocculation.
Since the adsorption of PCE molecules on the surface of cement particles is a prerequisite for the dispersion of cement particles, the adsorption process can be changed by adjusting the conformation of PCE molecules adsorbed on the surface of cement particles, thereby improving the dispersion performance of cement particles.
This article suggests that PCE molecular conformation is an important parameter affecting adsorption and dispersibility in cement paste. Most research focuses on changes in chain structure (especially monomer types and ratios) and the structure-activity relationship, that is, how chain structure influences adsorption and dispersion performance, but many issues remain unresolved. However, little detailed research has examined whether PCE conformation affects the adsorption process, and how it does.
In addition, improvements to the conformation of adsorbed PCE molecules have mainly focused on monomer type and proportion, such as side-chain length and grafting density. At the same time, little research addresses more fundamental parameters such as chain flexibility or hydrophilicity.
This article adjusts PCE conformation by modifying the rigidity and hydrophobicity of its main chain, enabling fine-tuning of its adsorption and dispersion in cement slurry. The rigidity and hydrophobicity of the PCE molecule’s main chain are tuned by changing the methyl content.
This study demonstrates that the dispersibility and adsorption process of PCE are influenced by its solution conformation, and through the study of its conformation, it is confirmed that the mechanism by which the methyl content on the main chain affects the dispersibility of PCE molecules is due to conformational differences.
Acrylic acid (AA), methyl acrylic acid (MAA), NaOH, ammonium persulfate (APS), NaHSO3, polyethylene glycol monomethyl ether methacrylate with an average molecular weight (Mn) of 2000 g/mol (named MAA-M2000, 50% aqueous solution). Before use, distill AA and MAA under reduced pressure. All experiments were conducted using deionized water. Record the proton nuclear magnetic resonance (1H NMR) spectrum of PCE in D2O solution. Gel permeation chromatography (GPC) was used to determine the molecular weight and polydispersity index (PDI) using a 0.1 mol/L NaNO3 eluent. P. I cement was used in the experiment, and the specific surface area, determined by the Brian method, was 385 m2/kg.
The monomer mass was set to 20% of the reaction system mass, and the initiators APS and NaHSO3 were each 1% of the monomer mass. First, water (30% of the final reaction solution) was added to a three-necked round-bottom flask and heated to 90 ℃. Over 2 hours, the monomer solutions (AA, MAA, and MAA-M2000), APS, and NaHSO3 solutions were added dropwise to the reaction mixture. The mixture was then held at 90 ℃ for 2 hours, then cooled to room temperature. The PCE solution was neutralized to pH 7.0 with NaOH solution and dialyzed against deionized water (3500 Da cut-off). Finally, the purified PCE sample was vacuum-dried and characterized by 1H NMR, FT-IR, and GPC.
Determination of fluidity
Use a cement slurry mixer for mixing. Gradually add 300g of cement and the prepared PCE sample (87g of solution containing the required PCE sample) into the mixing vessel. Stir at (62 ± 5) r/min for 2 minutes, then stir at (125 ± 10) r/min for 2 minutes. Fill the slurry into a truncated cone mold (60mm height, 36 mm upper diameter, 60 mm lower diameter). Quickly lift the truncated cone mold vertically and measure the cement slurry’s fluidity.
Determination of rheological properties
At 20 ℃, the shear rate was controlled, and the rheological behavior of the concentrated cement suspension was measured using a rheometer (R/S) equipped with a coaxial cylinder measurement geometry.
Adsorption measurement
Measure the adsorbed PCE content using a Total Organic Carbon (TOC) analyzer. Mix 25g of cement with 50g of PCE aqueous solution for a set period (e.g., 4 min or 60min), then take a portion of the slurry and centrifuge (10000rpm, 2min). Take the clear upper liquid, acidify it with 1 mol/L HCl, then dilute it to 1/10 of the original concentration. The difference in concentration between the PCE aqueous solution and the cement before and after mixing is the amount of PCE adsorbed by the cement.
Molecular Dynamics Simulation
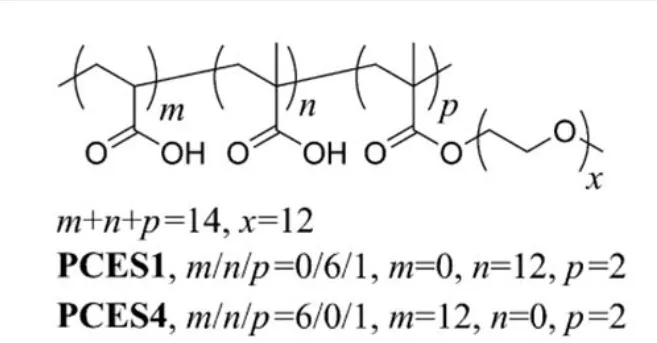
The copolymer studied in the simulation is smaller than the copolymer used in the experiment, but their structures are similar. The PCE molecular structure (as shown in Figure 1) consists of a main chain and grafted polyethylene glycol side chains. Two PCE structures with the same main chain length and side chain length but different proportions of AA and MAA units are used. Assuming all AA and MAA-COOH groups are fully ionized to -COO-, add the corresponding amount of Na+ to the solution to maintain the system’s electrical neutrality.
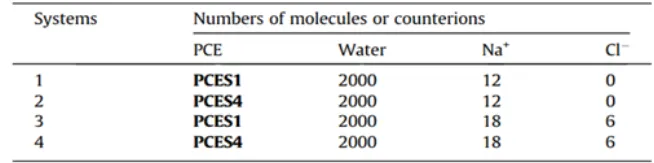
Table 1 lists four simulation systems, which include one PCE molecule and 2000 water molecules. In the pure water solution, 12 Na+ and PCE jointly maintain the system’s neutrality. We added two additional groups with 6 NaCl to simulate a salt solution, with a Na+ concentration of approximately 0.17 mol/L, consistent with the ion strength in the cement slurry.
This article also studied the conformation of polyacrylic acid methyl methacrylate allyl polyoxyethylene ether in the presence of Ca2+. Molecular dynamics (MD) simulations were conducted using the COMPASS force field.
Dynamic light scattering measurement
Measure the hydrodynamic radius (Rh) of PCE molecules at 1mg/mL in pure water and salt solutions at different pH levels using an ALV machine at a test angle of 90 °. Prepare a dispersion by adding saturated Ca(OH)2 solution to the aqueous nano-silica dispersion, and measure the adsorption layer thickness (ALT) on the simulated cement dispersion.
The traditional PCE molecule consists of a poly (methyl methacrylate) (PMAA) main chain grafted with poly(ethylene glycol) monomethyl ether chains. Substituting methyl groups on the main chain greatly increases stiffness, as the free rotation of the main chain in linear aliphatic polymers is easily hindered by steric effects. At the same time, methyl groups are hydrophobic and increase the hydrophobicity of the PCE main chain; however, replacing MAA with AA units changes the main chain’s rigidity and hydrophobicity.
To eliminate the influence of alkaline conditions (ester hydrolysis) on structural changes, we chose MAA-M2000 instead of acrylic ester. We synthesized the PCE sample by aqueous radical copolymerization of AA, MAA, and MAA-M2000 (as shown in Figure 2). Two PCE molecules (P3 and P6) with carboxylic acid groups and PEG monomethyl ether ratios (AER) ≤ 3.5 and ≤ 7.0 were synthesized by changing the monomer ratios to obtain polymer backbones with different methyl substitution rates (as shown in Table 2).
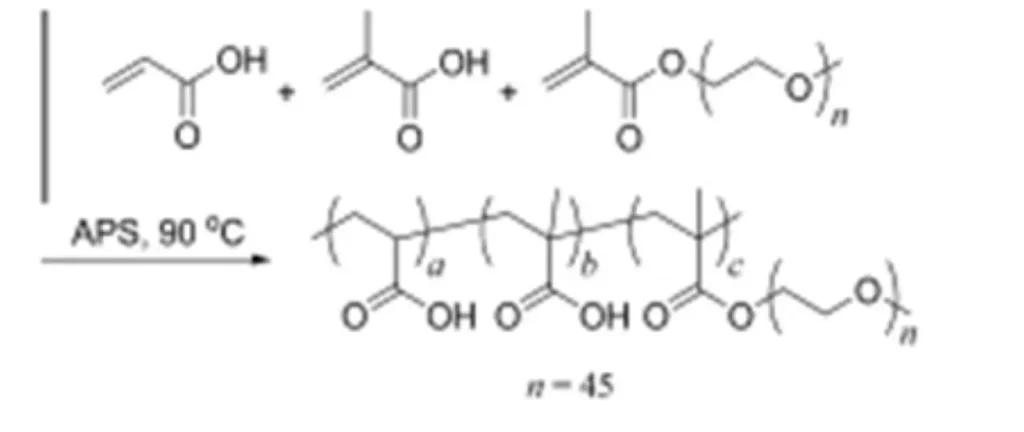
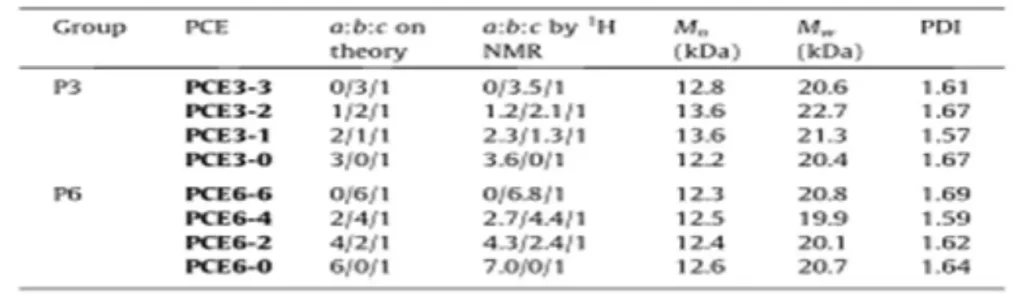
Figure 3 shows how different PCE samples affect the flowability of cement slurry, with higher flowability indicating stronger dispersion. At a constant PCE content of 1.1mg/g, PCE with low methyl content in the main chain shows good initial dispersibility (4 minutes).
The results at different PCE dosages (Figure 4) are similar. For AER ≤ 3.5 (P3 group), the dispersion ability decreases from high to low as follows: PCE with moderate methyl content in the main chain (PCE3-2, PCE3-1)>PCE with low methyl content in the main chain (PCE3-0)>PCE with high methyl content in the main chain (PCE3-3). However, for AER ≤ 7.0 (P6 group), the dispersion ability increases with the decrease of methyl content in the main chain (PCE6-0>PCE6-2>PCE6-4>PCE6-6).
Meanwhile, PCEs with high methyl content in the main chain experience faster fluidity loss (as shown by the fluidity-loss curve in Figure 3): PCE3-1<PCE3-2<PCE3-3, PCE6-0<PCE6-2<PCE6-4<PCE6-6). Among all PCE samples, PCE6-6 loses fluidity fastest during mixing, making it difficult to pour the prepared cement slurry into the truncated cone mold.
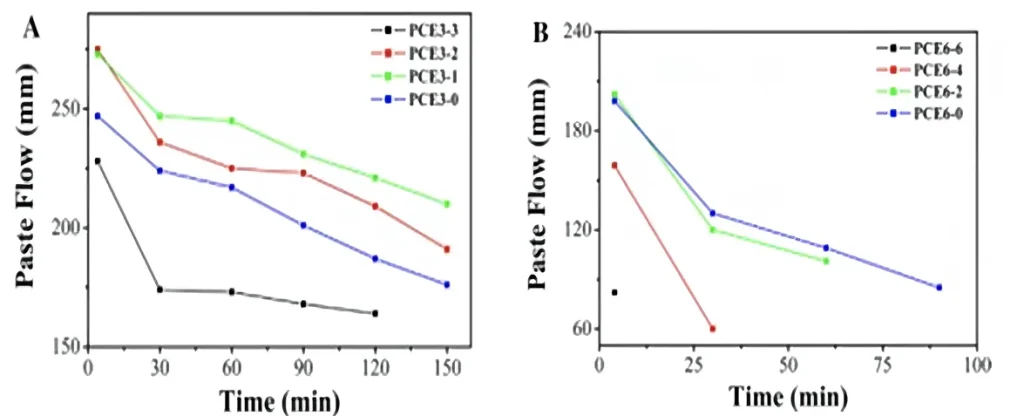
For PCEs with the same side-chain length, P6 PCE has a higher adsorption capacity than P3 PCE, but lower flowability than the P3 PCE slurry, and it loses flowability faster. Similarly, PCEs with higher methyl content in the main chain show faster fluidity loss, which may be due to their higher adsorption capacity, especially for P6 PCE samples. For PCE samples with carboxyl ratios close to P3, their dispersibility and flow retention ability are different (PCE3-0>PCE3-3), indicating that there may be differences in adsorption capacity and adsorption layer thickness.
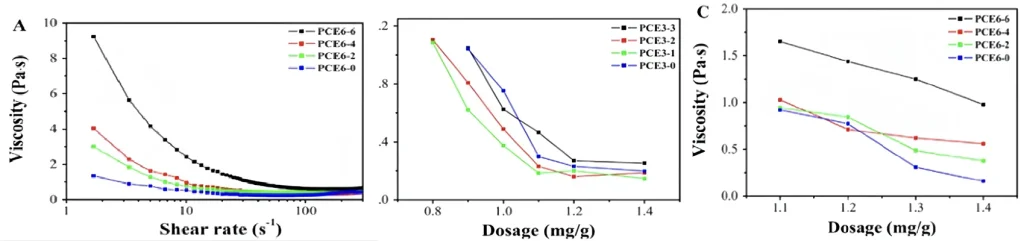
To assess the dispersion effect of PCE molecules, this study tested the rheological properties of cement slurries at different PCE dosages (Figure 4). It can be observed that regardless of the type of PCE, except for significant rheological behavior at high dosage or high shear rate, all suspensions of PCE-doped samples exhibit shear-thinning behavior (as shown in Figure 4). At low shear rates, mutual attraction between particles forms large flocs wrapped in water, which break down into smaller fragments at high shear rates, releasing the trapped water and reducing cement slurry viscosity.
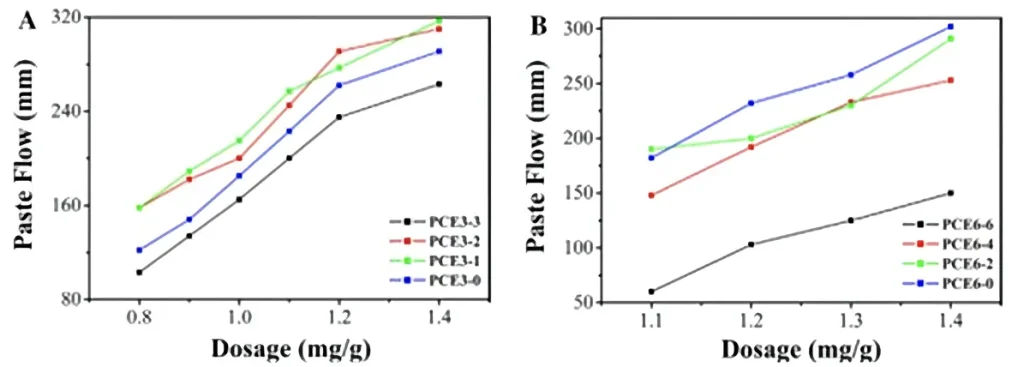
After adding PCE, repulsive electrostatic forces (related to carboxyl groups) and steric hindrance from long PEG side chains prevent cement particles on the PCE adsorption layer surface from flocculating, thereby stabilizing the cement dispersion system. As PCE content increases, the PCE layer becomes thicker; at the same time, the increased amount of adsorbed PCE increases the Zeta potential of cement particles.
As shown in Figure 5 (B and C), increased repulsive energy decreases viscosity. For PCE with AER ≤ 3.5, the viscosity of the cement slurry of PCE3-1 and PCE3-2 is always higher than that of PCE3-0 and PCE3-3. As shown in Figures 3 and 4, cement slurry viscosity in the P6 group increases from PCE6-0 to PCE6-6. It should be noted that under the same fluidity, PCE (P6 group) with a higher carboxylic acid ratio has a higher viscosity, which may be caused by the “bridging effect”.
The dispersing effect of PCE on cement slurry mainly depends on the steric hindrance caused by PCE molecules adsorbed on cement particles. To investigate the essential differences in dispersion behavior, TOC measurements were taken on the adsorbed PCE molecular weight (as shown in Figure 6).
Within 0-4 minutes, PCE molecules rapidly adsorb on the surface of cement particles. PCE with different AERs exhibit different behaviors: for the P3 group, it was observed that PCE molecules continued to adsorb until 120 minutes, and the time required to reach adsorption equilibrium was at least 60 minutes; For the P6 group, the adsorption capacity reaches its maximum value around 15 minutes and then slowly decreases. This indicates that the adsorbed PCE molecules and partially grafted PEG side chains hydrolyze into the solution.
As expected, PCE samples with the same AER and similar molecular weight show different adsorption capacities, which increase with methyl content in the polymer backbone: PCE6-0<PCE6-2<PCE6-4<PCE6-6, PCE3-0<PCE3-1<PCE3-2<PCE3-3. To further verify the differences in adsorption, the Langmuir adsorption model can be used to measure the adsorption constant K.
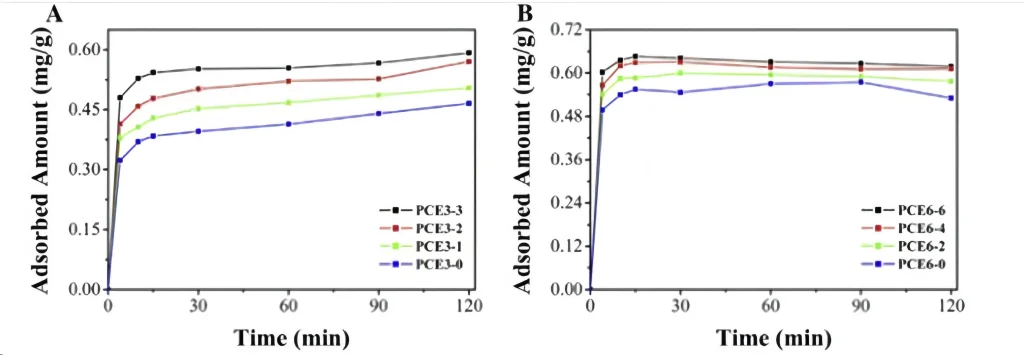
Because PCE molecules are consumed during cement hydration, it is difficult to evaluate the adsorption platform. Based on the adsorption results in Figure 6, the adsorption at 60 minutes is selected as the equilibrium state. Measure the adsorption capacity at different PCE dosages and perform linear fitting of [PCE] Sol/[PCE] Ads to [PCE] Sol (as shown in Figure 7). The results are listed in Table 5.
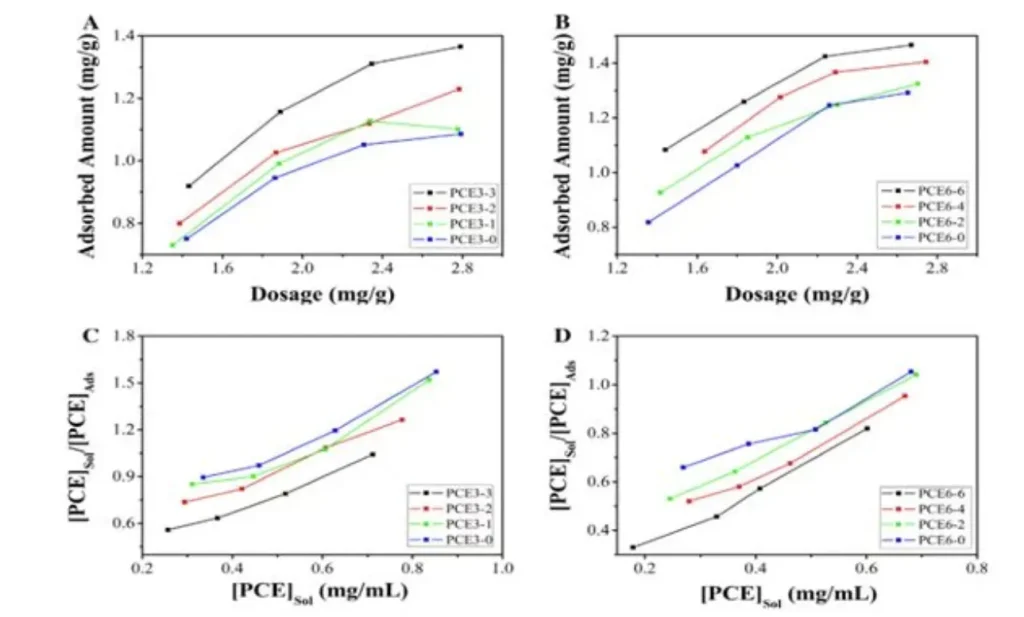
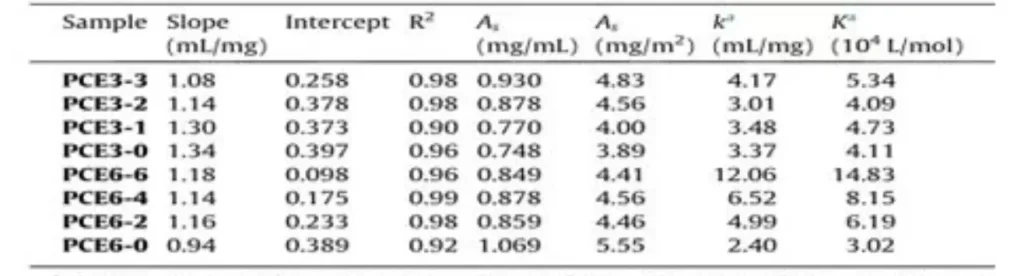
Regardless of the PCE structure (AER, methyl content in the main chain), the saturated adsorption capacity of PCE is almost always within the range of (4.7 ± 0.8) mg/m2. Meanwhile, the Langmuir adsorption equilibrium constant K seems related to the methyl-group content in the main chain. As the methyl group content in the main chain increases, K values for both P3PCEs and P6PCEs increase. Generally, PCEs with high charge density exhibit higher adsorption capacity (P6>P3), and the change in P6PCE is more significant.
Charge density is always positively correlated with the carboxyl ratio, while the charge densities of P6PCE and P3PCE are almost the same. This indicates that available and ‘accessible’ carboxyl groups are useful as anchor sites for adsorption.
This article proposes that some carboxylic acid groups in the polymer backbone are embedded in the coiled polymer chains in the electrolyte solution and cannot be used for adsorption. The “accessible” carboxylic acid groups exposed outside the coiled polymer molecules may coordinate with Ca2+ on the surface of cement and hydrated cement particles through electrostatic interactions.
Differences in methyl content in the main chain lead to differences in polymer conformation and, thus, in the density of “accessible carboxylic acid groups”. In addition, this study found that steric hindrance from methyl groups in the main chain restricts free rotation of the polymer backbone, making it easier for the backbone to stretch and approach carboxyl groups. The solution conformation of PCE molecules was studied through DLS and molecular dynamics simulations.
This article measured the hydrodynamic radius (Rh) of PCE molecules in different solution environments, and the results are shown in Figure 8. Because P6PCE has a longer main chain than P3PCE, the difference in Rh due to methyl content is more pronounced. Using P6PCE as an example, we first measure Rh in a pure water solution (Figure 8; PCE concentration is 1 mg/mL).
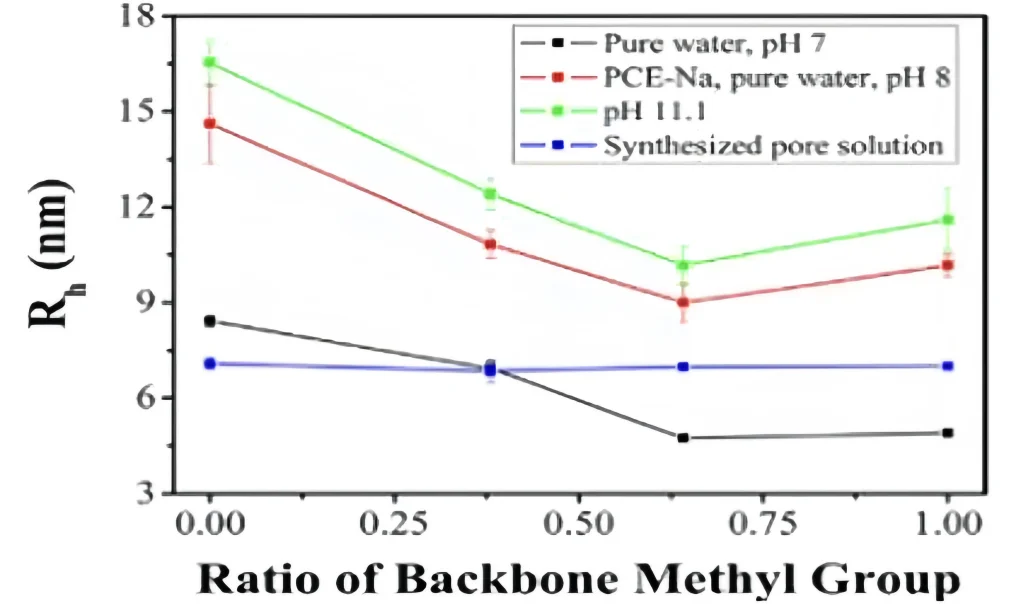
Research has found that as the main-chain methyl content increases in pure water, the PCE size decreases. The Rh values of PCE6-0 and PCE6-6 are (8.4 ± 0.2) nm and (4.9 ± 0.1) nm, respectively. It should be noted that the synthesized PCE samples were neutralized to pH 7.0, indicating the presence of – COOH and – COONa in the structure. Further neutralization of the PCE sample’s aqueous solution with NaOH to pH 8 indicates that all -COOH has been converted to -COONa.
Observing the extended molecular conformation, it was found that Rh increased in all samples, due to the increased electrostatic repulsion between ionized carboxyl groups with higher content, which caused the stretching of the polymer backbone. Further increasing the pH (pH=11.1, all carboxyl groups ionized) increases the ionization degree, and Rh increases accordingly. The Rh values of PCE6-0 and PCE6-6 are (16.5 ± 0.7) nm and (11.6 ± 1.0) nm, respectively.
PCEs with high main-chain methyl content and high adsorption capacity (PEG side chains), especially PCE3-3 and PCE6-6, show low dispersibility in cement slurry. According to DLVO theory, the dispersion effect of PCE molecules with long side chains mainly depends on steric hindrance and is affected by charge repulsion after adsorption onto cement particles. The zeta potential of cement suspension was measured at different PCE dosages and time periods, and the absolute values of all zeta potentials were below 10mV. This indicates that the electrostatic repulsion between cement particles is weak and cannot completely stabilize the cement system.
Therefore, the adsorption layer thickness was measured by DLS in simulating cement dispersion. Because alkaline solutions are stable and their adsorption behavior is similar to that of cement systems, this study used a water dispersion of nano silica particles with Ca2+ surface modification. In addition, the surface properties are similar to those of cement hydration products. By binding to Ca2+, PCE adsorbs onto the particle surface, similar to how PCE molecules adsorb onto cement particles.
Considering that PCE with high methyl content in the main chain (Ca2+- mediated adsorption) has a large adsorption capacity, research has found that PCE with high methyl content in the main chain has a smaller layer thickness (PCE3-0>PCE3-2>PCE3-3, PCE6-0>PCE6-6). Compared with PCE6-6, the thinner layers of PCE6-4 and PCE6-2 are attributed to their lower adsorption capacity.
The proposed mechanism is that, after adsorption, PCE with a higher methyl content in the main chain is smaller, but this may also be due to steric hindrance and the hydrophobicity of methyl groups. The steric hindrance of methyl groups impedes the free rotation of – COO – groups grafted onto the main chain, thereby hindering the elongation of PEG side chains. In contrast, the hydrophobicity of methyl groups may drive denser PCE side chains to move away from water molecules.
In summary, methyl content in the PCE main chain affects performance through the following pathways: PCE with higher main-chain methyl content shows greater conformational contraction and exposes more carboxyl groups in pure water solution. In cement slurry (pore solution), PCE with high main-chain rigidity shows less conformational shrinkage under high ionic strength.
Because methyl groups sterically hinder free rotation, more carboxyl groups are exposed. When approaching the surface of cement particles, strong interactions occur. However, PCE with higher methyl content (single-molecule) in the main chain adsorbs less, possibly due to differences in adsorption capacity (related to solution conformation) and adsorption conformation, which lead to differences in ALT.
Therefore, PCEs with different main-chain methyl content affect the fluidity of cement slurry differently. To improve dispersibility and fluidity, an appropriate amount of methyl groups can be introduced into the main chain of PCE molecules.
The experimental results indicate that the conformation of the PCE solution significantly affects the adsorption process. Some of the functional groups wrapped in the coiled polymer chain are not easily adsorbed. The methyl groups on the polymer backbone increase backbone rigidity, reducing the degree of conformational contraction of molecules in the pore solution and exposing more carboxyl groups. Therefore, PCE with high methyl content in the main chain has a higher adsorption capacity than PCE with low methyl content.
In addition, although the side-chain length is the same, the adsorption-layer thickness of PCE will also differ. This may be due to the hydrophobicity and hindered free rotation of polymer side chains, which limit the conformation of PCE with high methyl content in the main chain. Therefore, to optimize PCE performance, the main-chain methyl content should be appropriately tuned.
The results of this article provide a new direction for designing and improving dispersant performance, especially for PCE, by adjusting conformation through changes in stiffness and hydrophilicity. Unlike traditional methods that alter the anionic groups or long side chains with steric hindrance of PCE molecules, the conformation of PCE can be adjusted by adding a third component of small functional groups (such as a third monomer), including small groups substituted on the main chain (such as methyl groups or adsorption groups other than monomers introduced in this article) or other polymer side chains.

The Effect of Water Reducing Agents on Concrete from Macroscopic and Microscopic Perspectives
Blog The Effect of Water
Product information, specifications & applications — sent directly to your email.
*Your information is kept confidential and will only be used to contact you regarding our products.